Approaches based on modern portfolio theory (MPT) have dominated the financial industry for 60 years. Thinking in terms of factors such as value and size has deeply shaped the industry on both the provider and investor side. Institutional investors typically make their equity asset allocation decisions based on dimensions such as size, value vs. growth or quality and other factors; and the range of investment strategies offered by asset managers is typically guided by the same categories. Active management beyond factor returns (smart beta) is considered a difficult undertaking, and achieving outperformance based on publicly available information is even considered impossible.
These and other insights of the modern financial industry were considered indisputable just a few years ago. Today, they are still omnipresent, but are viewed more critically.
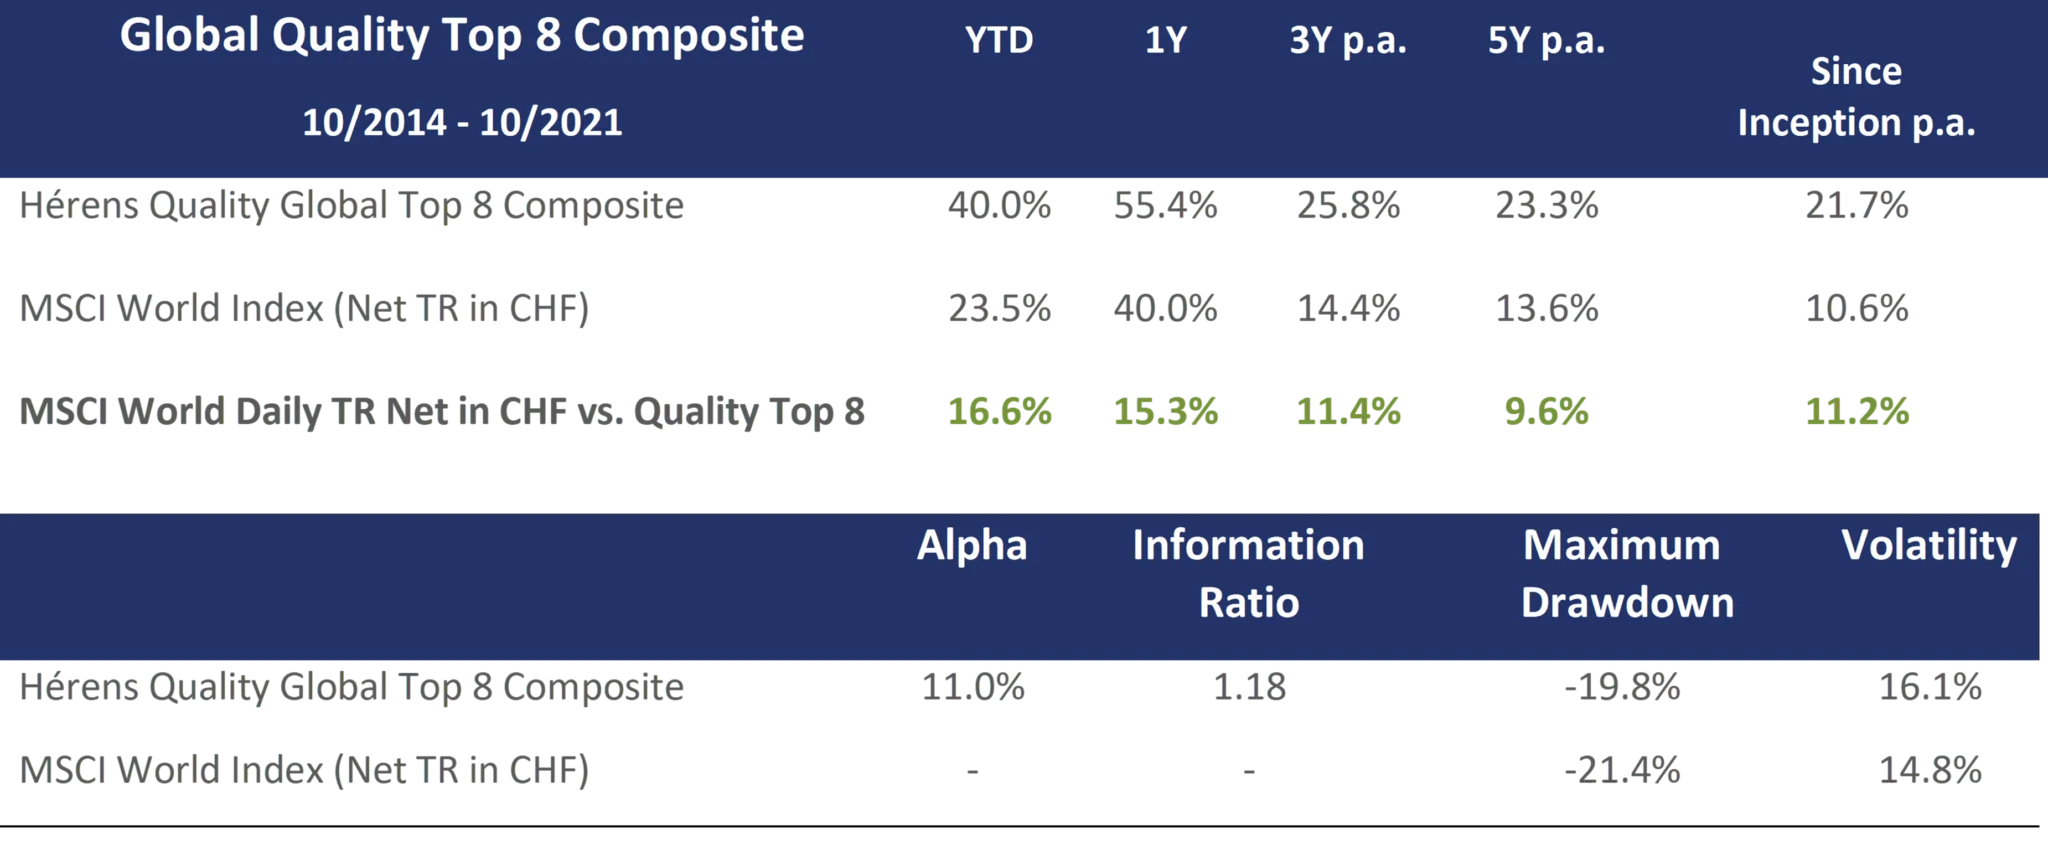
One of the challenges to MPT is a few active managers who regularly and systematically beat their benchmark. This includes the Quality approach of Hérens Quality AM with its track record of over 20 years. The ability to generate excess returns is particularly evident in concentrated Quality Top strategies.
Fig.1: Performance & risk metrics of Hérens Quality Top strategies*

Source: Hérens Quality AM, MSCI, Bloomberg
In this context, the question arises whether the achieved outperformance is the result of factor returns i.e. exposures to systematic risk factors, so-called smart beta, and/or pure alpha), i.e. the result of special skills in stock selection?
Quality alpha stands up to factor analysis
We investigate the issue empirically using Fama-French’s 3 and 5 factor model, drawing on the 7-year track record of the Global Quality Top 8 strategy, whose approach has been described in previous issues of CEI. The Fama-French model was originally an empirical model that was not initially preceded by any economic theory. The results were only subsequently explained by risk characteristics.
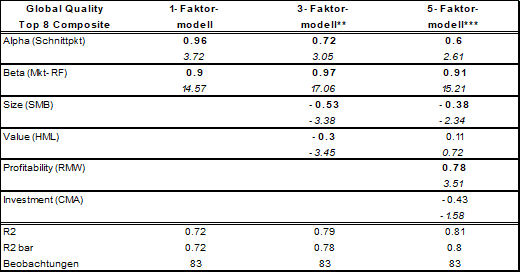
The following results in Table 2 show Quality Top strategies as an alpha supplier whose excess returns can only be partially explained by smart beta or investing in systematic risk factors. Here are the results in detail:
- Quality Top 8 has a significant and positive alpha in all models, including the 5-factor model. Alpha measures the outperformance or underperformance of the strategy that cannot be explained by the risk factors used in the model.
- With a beta of less than 1, Quality Top 8 invests in shares that are “safer” or less volatile than the market. An investment in Top 8 thus has a risk-reducing effect on the investor’s overall equity portfolio.
- Negative size effect: The results show a negative influence of the size factor (SMB) on the Top 8 performance and reflect the tendency to invest in larger stocks. The strategy thus does not benefit from the empirically proven small-cap effect, according to which smaller-capitalised stocks generate an above-average return.
- Negative or redundant value effect: The value factor (HML) is also empirically proven and states that stocks that are rather cheap in terms of a low book value in relation to the market generate above-average returns. The analysis shows a significant and slightly negative exposure to the value factor for the Quality TOP 8 strategy in the 3-factor model and reflects the tendency to buy shares that tend to be expensive in terms of a low book value relative to the market (growth tilt). In the 5-factor model, the value factor is no longer significant. This is consistent with results of Fama-French, according to which the average return of the value factor, through its exposure to the profitability and investment factors (RMW and CMA), is incorporated into these two factors.
- Positive profitability effect: The profitability factor (RMW), which is also empirically based, states that companies with a high operating profitability perform better. For Quality Top 8, the exposure is positive and significant, i. e. part of the outperformance can be explained – unsurprisingly for a quality strategy – by the investment in companies with above-average profitability.
- No investment effect: The investment factor means that shares of companies with high investments (measured by total asset growth) underperform. In the case of Quality Top 8, the investment factor (CMA) is not significant, i. e. it does not contribute to explaining the outperformance.
Fig.2: Factor sensitivities of the active returns of the Hérens Quality Global Top 8 Composite

Values with 5% significance are printed in bold
Overall, the model has a fairly high explanatory power: the coefficient of determination R-squared measures how much of the variability in outperformance can be explained by the factors used in the model. An R2 of 80% shows that 80% of the data fit the regression model, i.e. the significant factors explain 80% of the outperformance of the top 8 strategy.
Quality alpha – a combination of factor returns and pure alpha
The results show that part – but not all – of the outperformance of the Quality Top 8 strategy is due to the systematic use of the profitability factor (RMW), the rest is pure alpha. Now, proponents of MPT or the efficient markets hypothesis would speak of randomness rather than true alpha at this point. Whether Hérens Quality AM was simply just lucky so far in managing the Quality Top strategies or, on the contrary, has given prove of skill, the investor must form his own opinion on this. To support him in his opinion-forming process, we will provide further arguments in the following issues of the CEI why outperformance is no coincidence and should continue.
*Global Quality Top 15: Portfolio performance: Gross TR (excl. transaction and management costs, dividends reinvested. Simulated performance 01.10.2014 01.10.2018, fully based on monthly investment process of Hérens Quality AM; Live track record since 01.10.2018)
** Zeitraum: Oktober 2014 bis August 2021. rtTop8 – rtf = α +β1 (MKTt – rtf)+ β2SMBt + β3HMLt +εt. . Die zu erklärende Variable sind die monatlichen Brutto-Überrenditen des Hérens Global Quality Top 8 Composite in USD (monatl. Renditen minus risikoloser Zins). Die erklärenden Variablen sind die Monatsrenditen der Fama French-Faktoren Size und Value sowie die Überrenditen des Marktes (Markt minus risikoloser Zins).
*** Period: October 2014 to May 2019. rtTop8 – rtf = α +β1 (MKTt – rtf) + β2SMBt + β3HMLt +β4RMWt + β5CMAt + εt.. The variable being explained is the monthly gross outperformance of the HQAM Global Quality Top 8 Composite (composite return less risk-free rate of return). The explanatory variables are the monthly returns produced by the factors Size (SMB), Value (HML), High Profitability (RMW) and Low Investment (CMA), as well as the outperformance produced by the market (market less risk-free rate of return). Abbreviations: SMB = Small Minus Big; HML = High Minus Low; RMW = Robust Minus Weak; and CMA = Conservative Minus Aggressive.
