Dramatic 2022
2022 was a shock year not only for equity investors but also bondholders, as the usual low correlation between the two asset classes broke down, and we saw harsh losses across the whole portfolio. This situation was especially dire for individuals nearing retirement, as they witnessed their supposedly conservatively managed pension fund capital being decimated.
Bonds, usually considered a shield against risk, experienced a decline in value equivalent to that of stocks. This was emotionally impactful due to higher expectations placed on bonds compared to stocks, which are often perceived as more volatile.
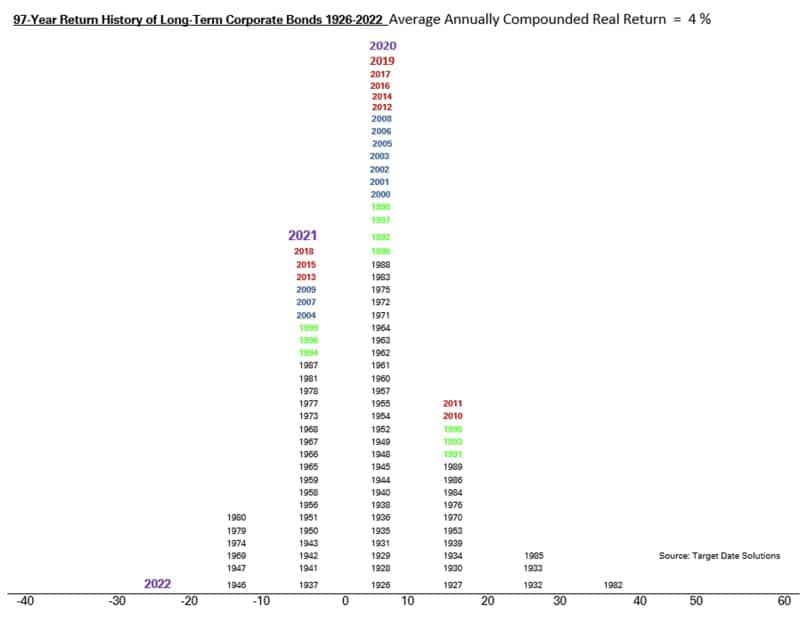
2022 marked the worst year on record for bonds (see Fig. 1). Even in 1980, a year considered unfavorable for bonds, the situation was not as dire. Inflation and, consequently, interest rate hikes acted as catalysts for the deterioration in bond values. The exceptionally rapid increase in interest rates was the primary factor responsible for the dramatic decline in bond prices. It represented the most significant historical surge in interest rates, with the effective federal funds rate rising by nearly 5% in just over a year.
Figure 1: Years classified according to Vanguard Total Bond Index annual real return cluster

Source: Target Data Solutions, Nasdaq
Stocks and Bonds
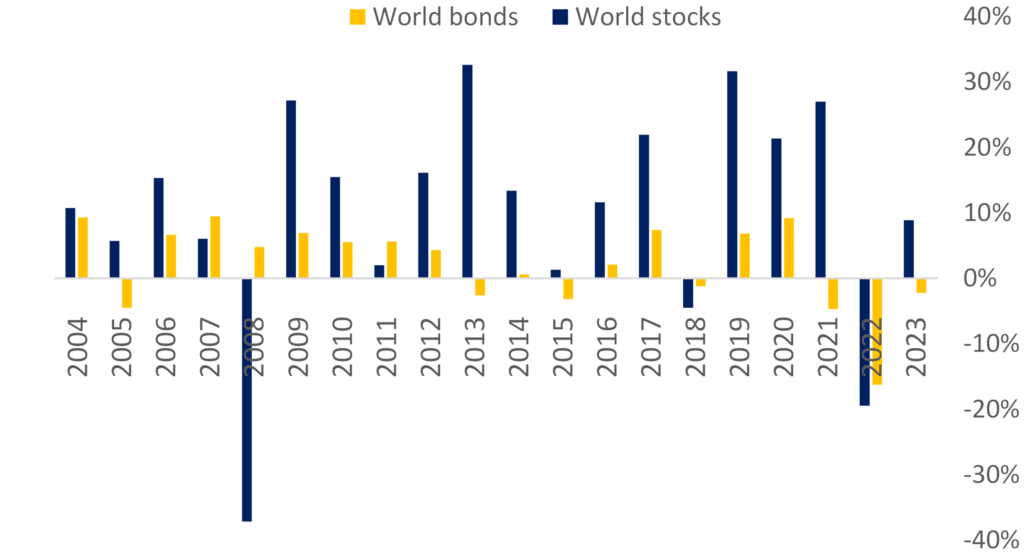
Including different asset classes in a portfolio offers diversification, stability, and a reduced risk of significant declines. A prerequisite for achieving these benefits is a non-perfect correlation, preferably a low or even negative correlation. Stocks and bonds have long been a popular combination, exemplified by the classic 60/40 portfolio, precisely because they provide this type of correlation. Since 2004, the correlation between these two asset classes in the USA has been 30%, in Europe – 18%, and in developed countries – 31%. As depicted in Fig. 2, the advantages of incorporating bonds into a portfolio become evident. Bonds act as a protective shield during market downturns, as discussed previously (with the exception being the year 2022).
Figure 2: Bonds vs. Stocks annual performance (Bonds: Bloomberg Global-Aggregate Total Return Index Value Unhedged USD, Stocks – MSCI World Gross return, USD)

Source: Hérens Quality AM
Is 60/40 strategy broken?
From 1982 to 2021, bonds delivered an average return of 6.2%, which is not far off from the 7.4% average annual returns offered by stocks. This period is often referred to as the ‘golden age’ for bond investors and is not necessarily representative of future returns given the average real return on bonds of just 0.6% since 19001. However, what lies ahead, given the current high interest rates are to stay for at least for a while?
Historically, bonds have provided a certain defense against stock market downturns. Since 2004, the volatility of bonds has been ca. three times lower than that of equities. In the US, bond volatility is 5% compared to 16.9% for equities, while in Europe, it’s 5.9% versus 17.4% for stocks. There is no compelling reason to believe that this situation should undergo a dramatic transformation, rendering bonds a broken asset class. The bond segment is well-positioned to regain stability after the tumultuous events of 2022. The 60/40 stocks/bonds strategy remains viable; however, the allocation of bonds in an investment portfolio should be contingent on one’s time horizon and risk tolerance.
Quality status importance
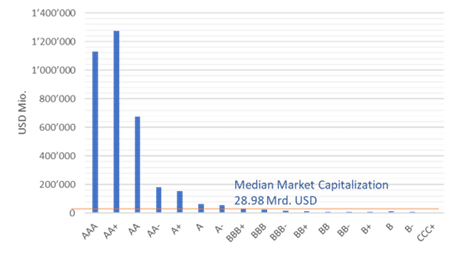
The attention though should be turned to the bond quality, as it may not always be accurately reflected in the credit ratings assigned by rating agencies. History has taught us not to place unwavering trust in these ratings but to conduct our own assessment of quality. For instance, in January 2007, the median bond rating of S&P 500 financial companies was at a robust A level. However, within a short span of 1.5 years, it swiftly plummeted to BBB+, completely skipping the A- rating category. Additionally, it’s worth noting that higher ratings tend to be disproportionately concentrated in the financial sector and among larger-sized companies, as illustrated in Fig.3.
Figure 3: Distribution of S&P ratings based company’s size, 2022

Source: Hérens Quality AM
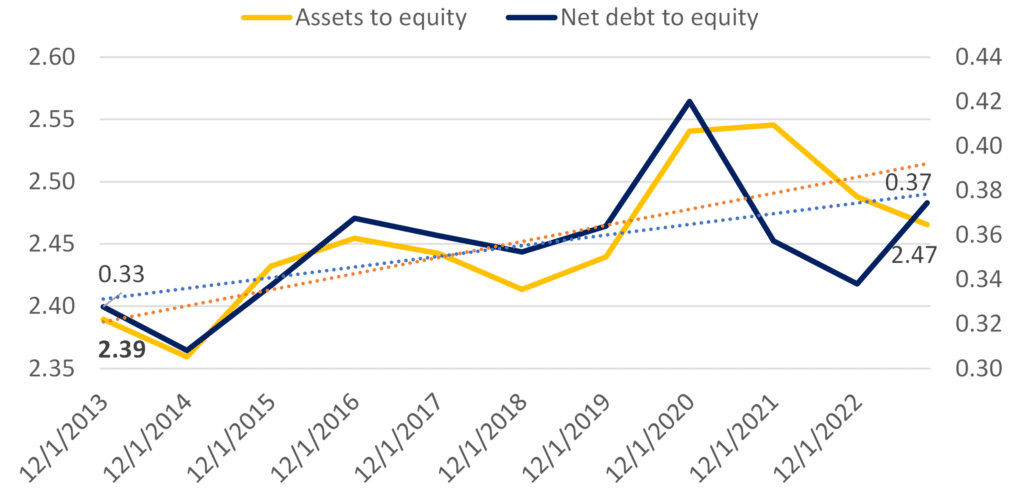
Higher attention to balance sheet quality and cash flow generation ability of the issuer is stimulated by the macro situation. During the last decade the interest rates were below the floor stimulating leveraging of the corporate sector – solvency ratios have worsened (Fig.4).
Figure 4: Assets to equity and net debt to equity of MSCI World constituents

Source: Hérens Quality AM
In conclusion, it can be said that given the higher interest rates that are nearing their peak, bonds show attractive performance prospects and are expected to still offer great diversification benefits to an equity portfolio. However, higher interest rates also mean that borrowing is more expensive now. Coupled with a weak economy and worse solvency ratios this could lead to higher bond issuer bankruptcy risk. Hence, quality analysis of companies to identify bonds with excellent yield/risk ratio has never been more important.
References:
1. https://www.ft.com/content/f94c233b-98a5-4f7d-b761-faf15f50ead1.
