Fatal Attraction
Did you know that there are over 630 different meat-eating, flowering plants in the world? Like pitchers, for example, that trap insects, frogs and even mice. They attract their prey with the sweet nectar and juicy flesh that looks like a perfect food for the victim. How is it relevant in the context of equity investing? Extremely, and now more than ever.
Given a mind-blowing global stock markets rally of 2019 that seem to be transposed into 2020 as well (even coronavirus outbreak was not enough to stop this train), there are many people out there that stayed on the sidelines after Q4’18 meltdown and now are in a rush to catch the last train, driven by blinding fear of “missing out”. This elevated sense of greed cancels out all other alarming noises, from overstretched valuations to weaker economic growth and constrains the ability of thinking straight. FED’s eagerness to continue injecting liquidity in the market and ECB’s lightweight monetary policy only makes the whole situation even more complex and twisted. Does it mean you have to stay from equities for the time being? Not at all. Rather, it means that if you want retirement plan to succeed (or whatever other investment purpose you have), you have to be prudent, consistent and what is even more important – extremely selective. And never ignore fundamentals, because they do tell a story and will most certainly be helpful in avoiding “the pitchers”
Thomas Cook: who could have known?
With “excellent progress” on US-China trade truce and uncertainty over fate of Brexit congesting the news flow in 2019, the fact that preceding year was rather eventful on bankruptcies could well have been overlooked – once dearly loved Forever21, PG&E and Thomas Cook (TC) to mention a few. Collapse of the latter came as a shock, especially to the holidaymakers and employees. However, if one studies TC’s fundamentals and balance sheet structure, unexpected turns into something rather inevitable.
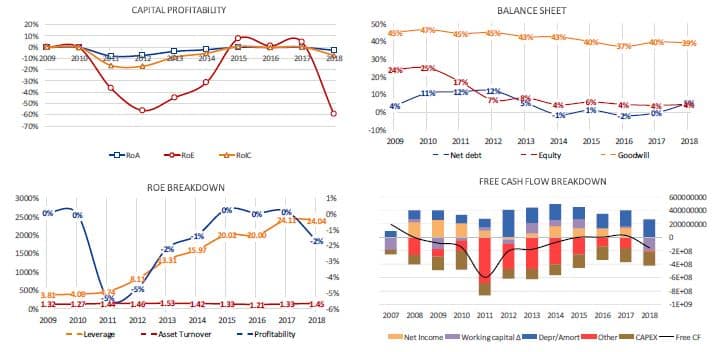
Fig. 1: Extract of Financial Condition Check for Thomas Cook

Source: Hérens Quality Asset Management, Reuters
With goodwill accounting for a lump sum of the balance sheet (39%), humungous leverage (24.04) and virtually no return on capital despite equity ratio barely reaching 5%, Thomas Cook really did not need much of additional pressure to collapse like a straw house. When Thomas Cook collapsed, it was bearing £1.6 bn in debt, had negative operating cash flows and its’s Altman Z-Score was barely hovering above “1”. Curious is the fact that eight years ago company escaped insolvency by a whisker and in 2013 have had real struggle with borrowing capability. Group of banks, led by Royal Bank of Scotland, and fundraising from shareholders saved them then in the first and in the second instance.
The Magic of “Z”
It is commonly perceived that a Z-Score above 2.99 puts a company in a “safe zone”, while that below 1.88 (so-called “distress zone”) indicates that high probability of a bankruptcy within next two years.
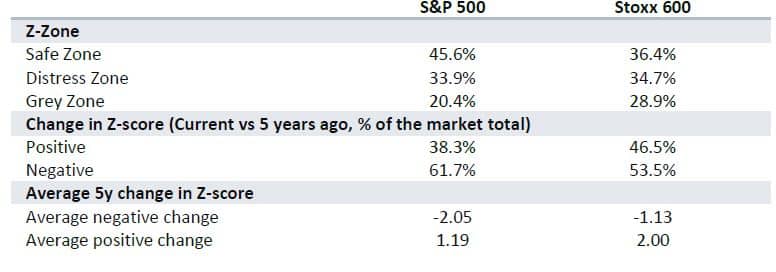
Range between 1.88 and 2.99 is therefore considered to be a “grey zone” (1). Despite that E.I.Altman came up with this formula over 60 years ago, it remains one of the best red flags for insolvency. Looking at American and European equities, one can’t help but notice that while both in Europe and US around the same percent of companies fall into “distress zone” (close to 1/3 of the universe), latter has substantially larger share of stocks seeing this indicator deteriorate over last 5 years (61.7% vs 53.5%).
Fig. 2: “Zones” and 5y dynamics of Z-Scores for S&P 500 and Stoxx 600

Source: Hérens Quality Asset Management, Reuters
Also sector-wise there is a significant difference – in Europe, majority of companies with a Z-score below 1.88 are found in Industrial (19.6%), Real Estate (17.4%) and Communication (15.2%) sectors, while in US these are Utilities (29.3%), Discretionary (20.7%) and Energy (10.9%) stocks.
All levered up
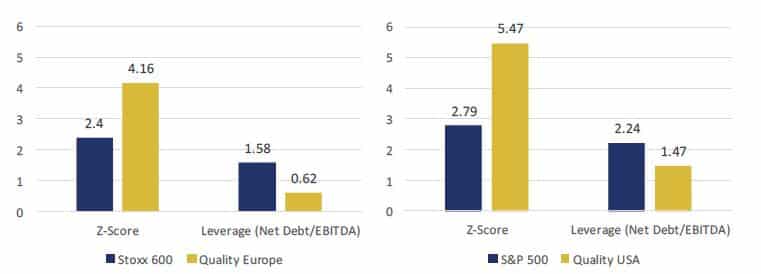
Greater deterioration in Z-Score in US should not come as a surprise, given the quantity of additional debt and the speed at which domestic stocks have been accumulating it. According to Washington Post, US corporations are sitting on $10.1 trillion in corporate debt that is equivalent of 47% of GDP – a record number since the financial crisis and they have issued $1.2 trillion in last 2 years alone. Alarming is the fact that in Nov’19 report, Fed stressed out that the riskiest companies accounted for a bulk of rising debt in recent years and BBB- rated bonds (lowest investment grade) now account for more than 50% of the market (2). When things go down (and they finally and inevitably will one day), guess who’ll turn into nothing but a sitting duck? Therefore, one needs to pick up good cherries, leaving rotting ones behind and fundamentals might well be one’s best assistant. They’ll be as useful in spotting “zombies” (link) as they will in pointing out quality investments with strong balance sheets and resilient business models.
Fig. 3: Median Z-Score and Leverage for Quality Companies and respective Benchmarks (as of 31.12.2019)

Source: Hérens Quality Asset Management, Reuters
It does not mean that a quality company cannot fail and turn into an unfortunate investment, but the chances that it will are significantly lowered. And when uncertainty looms, perhaps quality is a good place to sit back and wait for the storm to pass.
References
- Altman, Edward I. (September 1968). “Financial Ratios, Discriminant Analysis and the Prediction of Corporate Bankruptcy”. Journal of Finance: 189–209
- Board of Governors of the Federal Reserve System (November 2019). “Financial Stability Report”, available at https://www.federalreserve.gov/publications/2019-november-financialstability-report-borrowing.htm
