EXECUTIVE SUMMARY
Japan may seem like an unusual place to seek investor returns as reputation of the local stock market is still marred by reminiscence of Japanese market bubble in the 1990s and the subsequent years of depressed economic conditions, which came to be known as “The Lost Decade”.
However, we want to challenge this view, as we believe that the era of low returns is long time gone, which is evident from the robust performance of Japanese equities in the past years. In this white paper, we highlight key developments we have been observing on the Japanese corporate front and explain main drivers behind the paradigm shift.
While Japan’s monetary policy is indeed providing support to the financial system, we look deeper and explore recent development of Japanese companies to understand the reasons behind market turnaround. The facts we have discovered are all pointing to the same direction – Japanese corporate world is undergoing a transformation, which, in turn, is fueling the stock market.
We see positive dynamics in fundamentals, such as decreasing debt levels, coupled with growing profitability and returns, which are rapidly catching up with international peers. We also notice a wave of change in corporate governance, which is becoming more shareholder-oriented, as Japanese corporate governance practices are becoming more aligned with international standards. Japanese companies are also putting more emphasis on rewarding their shareholders, which is proven by rising dividend yields and payout ratios. In addition, we note that Japanese stock market is characterized by attractive valuation multiples, when compared to the U.S. and European markets. At the same time, growth rates of companies in Japan is not severely behind the ones observed in other developed markets.
Supported by the abovementioned factors, Japanese equities are set to deliver robust long-term results, which can be magnified even further, when supported by careful stock selection.
INTRODUCTION
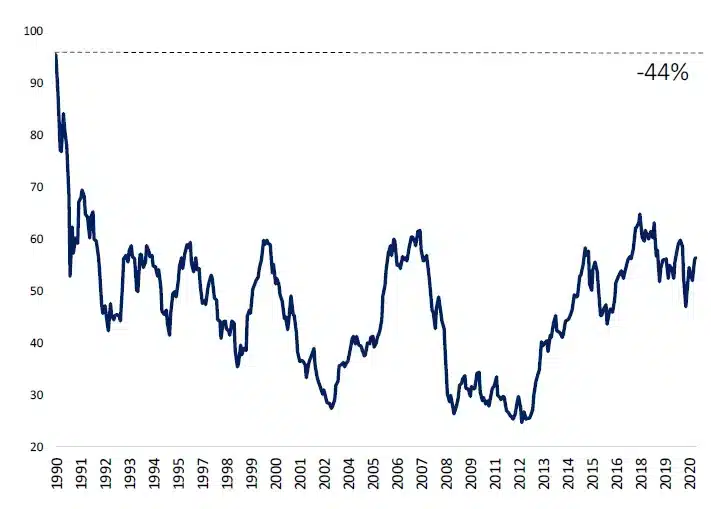
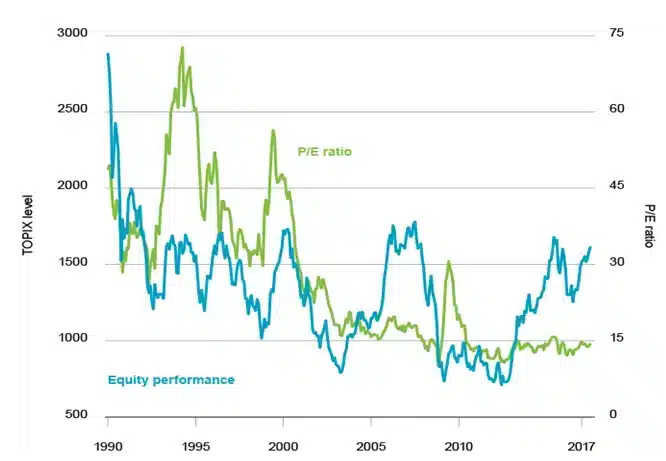
USD 6.7bn, or more than 3 times of annual net profits of Netflix, was invested by Warren Buffet in Japan through acquisition of stakes in large and listed Japanese trading companies. The news that came out in the middle of August, were very surprising for many as Japan has long been shun by investors, often dismissing the country as the underperforming market. Indeed, Japanese equities still have not recovered from their highs reached in the late 80s. As shown in Fig. 1, the value of Topix Index is still 44% lower than in the beginning of 1990-s, when the stock market bore a P/E of more than 70 and was unsustainably overpriced.
Figure 1: TOPIX Index performance 1990-2020 (01.10.2020)
Source: Hérens Quality AM, Thomson Reuters
Figure 2: TOPIX Index P/E ratio 1990-2017
Source: BlackRock
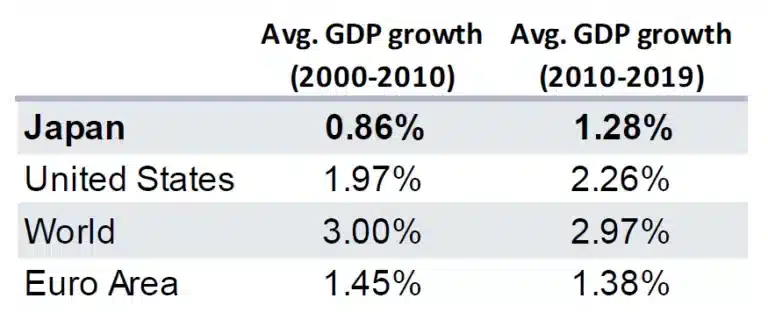
However, “lost decades” era seem to be finally complete. Average growth of the Japanese economy improved during the last decade, being now close to European average growth rates, which was well reflected on the equity markets
Figure 3: Average GDP growth 2000-2010 vs. 2010-2019 in the developed economies
Source: World Bank
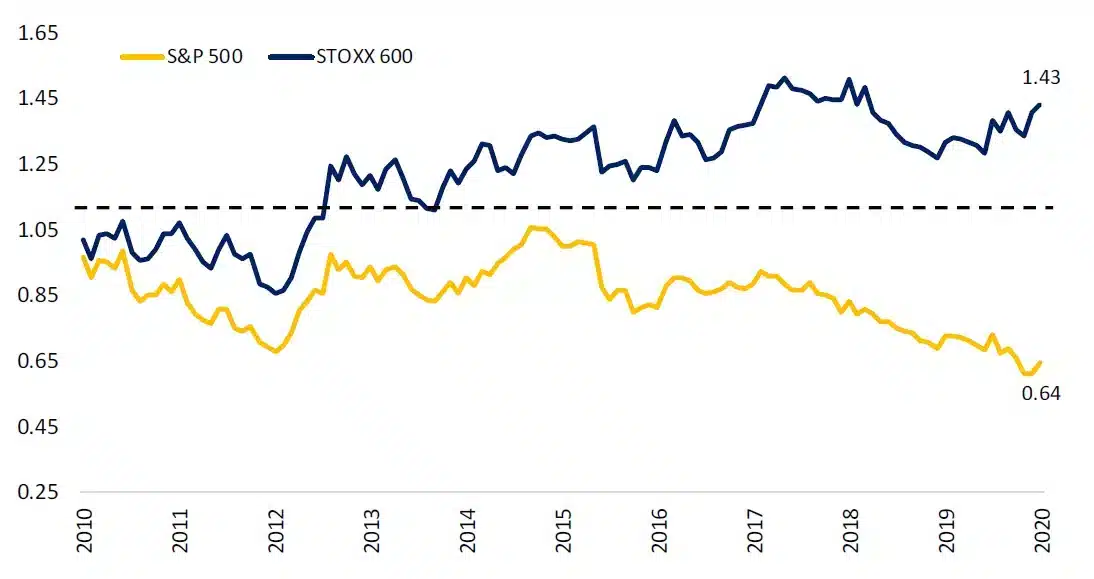
During the last 10 years Topix returned 81% (in JPY), outperforming European equities (in EUR), though it considerably lags behind US stocks (in USD). Apparently, the market is not only driven by the local investors – international investors have also been slowly regaining trust in the Japanese stock market and becoming increasingly more aware of the opportunities it presents, as percentage of market value owned by foreign investors has risen from 19% in 2000 to 30% in 20191.
Figure 4: Japanese equity (Topix in JPY) vs. US (S&P 500 in USD) and European (Stoxx 600 in EUR) performance, Monthly Price Return (01.10.2010-01.10.2020)
Source: Hérens Quality AM, Thomson Reuters
What is behind the market turnaround?
One of the reasons behind market turnaround is monetary stimulus launched by the Bank of Japan, which provides support for the equity markets. However, we believe that there is also a tandem of other factors, which facilitated regaining of trust in the Japanese stock market: a) an ultimate improvement in corporate fundamentals, which admittedly were very weak ten years ago; b) general improvement in the corporate governance, which was considered very traditional, lacking transparency, inflexible and outdated2
Support from the bank of japan
Back in 2010, as a part of the stimulus package to revitalize the economy, the Bank of Japan (BOJ) initiated a comprehensive monetary easing policy3. This policy included an asset-purchasing programme, which, in addition to government bonds, also covered corporate bonds, real estate investment trusts (REITs), exchange-traded-funds (ETFs) and commercial paper, with the aim of stabilizing the equity market, lowering the risk premium and encouraging investment. For example, as part of the programme, the BOJ has accumulated close to 80% share of all ETFs in the country. However, looking at total market capitalization, the BOJ owns just slightly over 5%4. Overall, the size of the BOJ’s balance sheet has ballooned in the recent years – the BOJ’s asset holdings now reach almost 126% of GDP, up from 25% in 2010, and compared to just 34% for the Federal Reserve and 53% for the European Central Bank5. While the asset-purchasing initiative props up the equity market, we believe that it is just a part of the story, as there are also fundamental improvements with respect to quality of Japanese companies and those will be outlined in the following sections.
Decreasing debt levels
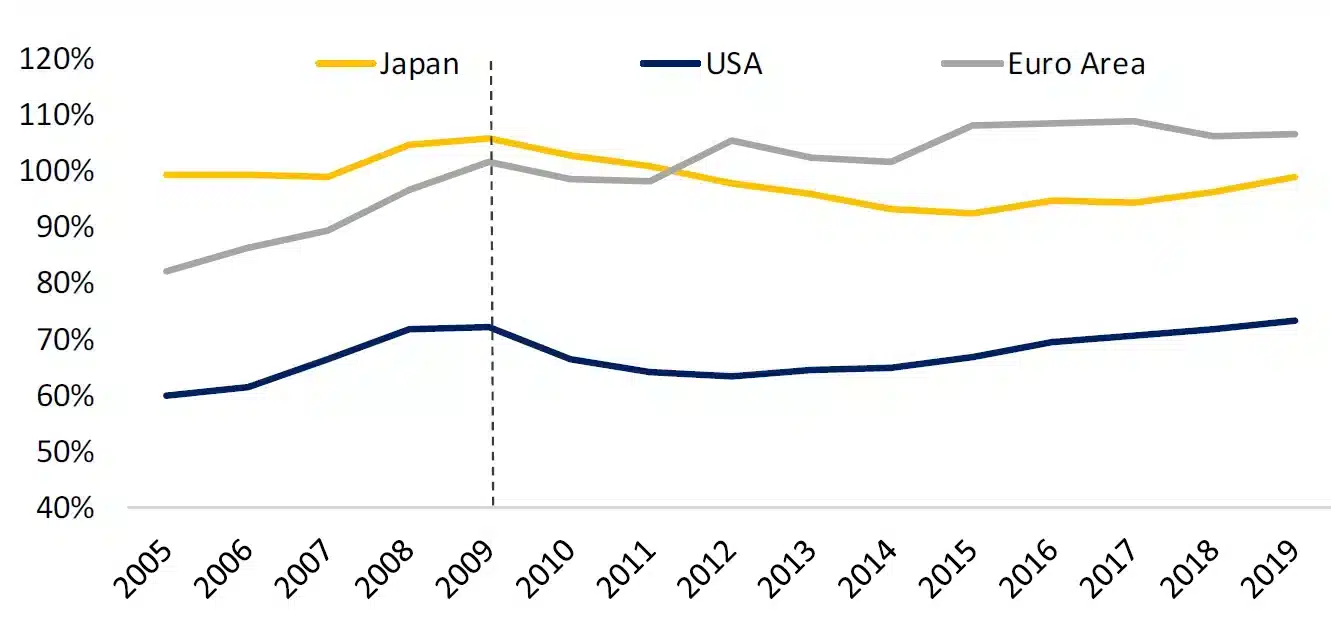
To begin with, let’s untangle some of the recent corporate trends we have noticed, starting with the issue of debt – a problem, which became even more acute in 2020. The global pandemic has had a major influence on the structure of the global economy: it accelerated widening gap between strong and weak industries, spurred development of e-commerce and IT giants and also caused giant spikes in the national and corporate debt ratios. Total global debt reached a new record of 331% of GDP in 1Q 2020 since December 20196, primarily caused by increasing indebtedness of mature markets. Sovereign debt champion remained the same as it was for the last 30 years – Japan with a national debt at 236% of GDP, followed by Greece owing 180% of GDP. Essentially, this is a legacy debt of 1990-s Asian crisis, which not only has never been paid down, but on the contrary was increased following the trend of growing sovereign debts across the globe. However, on the corporate level things look quite different, and this is where Japanese companies can be praised. Since the debt peak in 2009 corporate debt to GNP in Japan decreased by 7%, while in US it rose by 1.5% and in Europe – by 5%.
Figure 5: Total Debt of Non-Financial Corporations, % of GNP
Source: World Bank, Bank of International Settlements
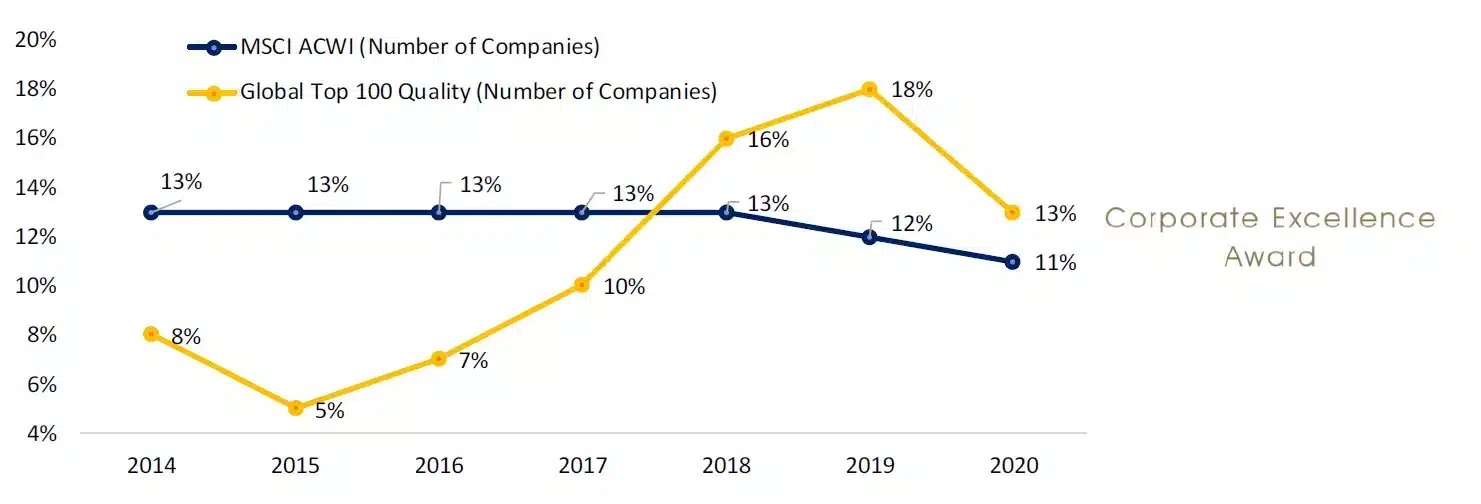
Successful deleveraging of Japanese companies after the financial crisis was one of the reasons why more of Japanese firms tend to enter Global top 100 – our top list, consisting of quality companies based on corporate excellence analysis (see www.hqam.ch/awards). In 2014, the share of Japanese firms was only 8%, while in 2019 it increased to 18%, although their share in the world stock index remained stable. In 2020 award, 13 out of Global Top 100 Quality companies came from Japan, compared to just 5 companies 5 years ago.
Figure 6: Share of Japanese companies in MSCI World AC and in Global best 100 companies based on Excellence award methodology
Source: MSCI, Hérens Quality Asset Management
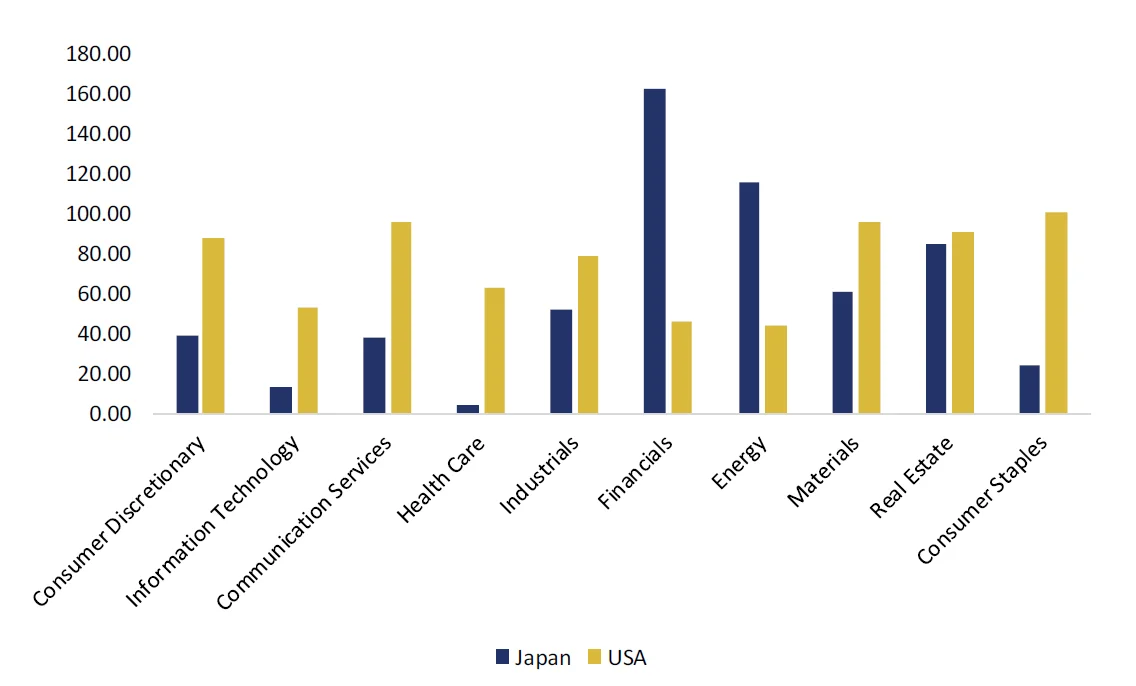
This is quite surprising, given that Japanese companies have always been heavily indebted and exhibited low profitability levels. Those were also the reasons behind the need to lower the bar for company selection criteria as compared to US and European universes in order to ensure there is sufficient number of companies on our investment radar. Indeed, many well-known Japanese companies, such as Toyota or Sony, managed to enhance their financial positions through reduction of debt and improvement of capital profitability, thus becoming more attractive for the investors believing in quality. It is necessary to note that the debt within Japanese universe is rather concentrated in Financial and Energy sectors (Fig. 7), while remaining sectors seem comparatively more conservative in their financing structure, giving preference to deployment of less risky resources, such as retained earnings, to facilitate growth. This situation is quite different from the one in the USA, where all sectors exhibit comparable debt levels.
Figure 7: Debt-to-Equity ratio of MSCI Japan and MSCI USA indices by sector as of 31.09.2020 (median method)
Source: Hérens Quality Asset Management, Thomson Reuters
The reasons are rooted in Japanese culture. The way of doing business in Japan differs significantly from the way things are being done in U.S. While American companies are eager to use borrowed capital to generate profits faster and satisfy shareholders with sizeable returns, in Japan, profit maximization may often not be the primary goal7. Firstly, Japanese corporate governance follows a more stakeholder-centric approach, considering a diverse range of groups impacted by the company. Secondly, what is incredibly important for this nation, is respect for values and traditions, and preservation of the Company amid difficult times. Japan’s corporate leaders remember the “Lost Decade”, the period of economic stagnation from 1991 to 2001, which saw almost no growth and spiking bankruptcies. Having learnt the past lessons, companies are opting for a more conservative growth path, relying more on internal resources rather than borrowings. And when the crisis hit this year, Japanese companies remained largely resilient: bankruptcies in the first 6 months rose by a mere 0.2% from a year earlier8, while in the U.S they surged by 26% year-over-year.9
Growing profitability and returns
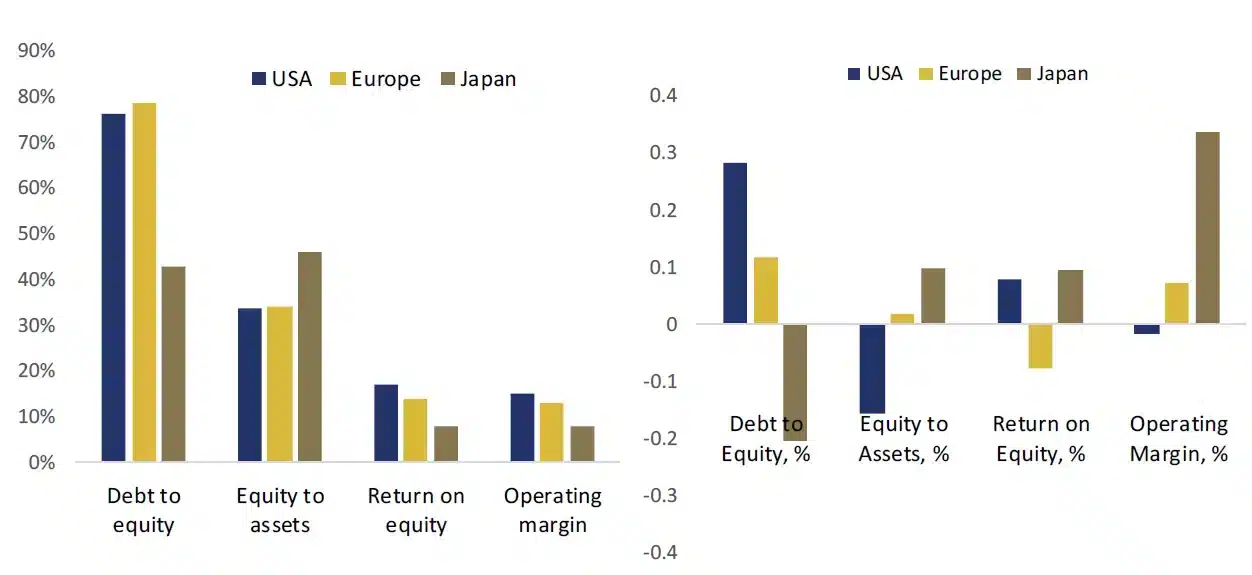
The improvement of balance sheet quality is not the only positive development in Japanese corporate world, as companies are also becoming more efficient in managing their capital to generate higher returns. While improvements in profitability and returns of American and European companies haven’t been as pronounced recently, Japanese companies, which have been always lagging behind, started to catch up. It seems that there was a true revolution in financial management among latter as fundamentally now they look much better than they did several years ago.
Figure 8: Absolute fundamental ratios of US, European and Japanese firms and their dynamics, MSCI (31.12.2013-30.09.2020)
Source: Hérens Quality Asset Management, Thomson Reuters
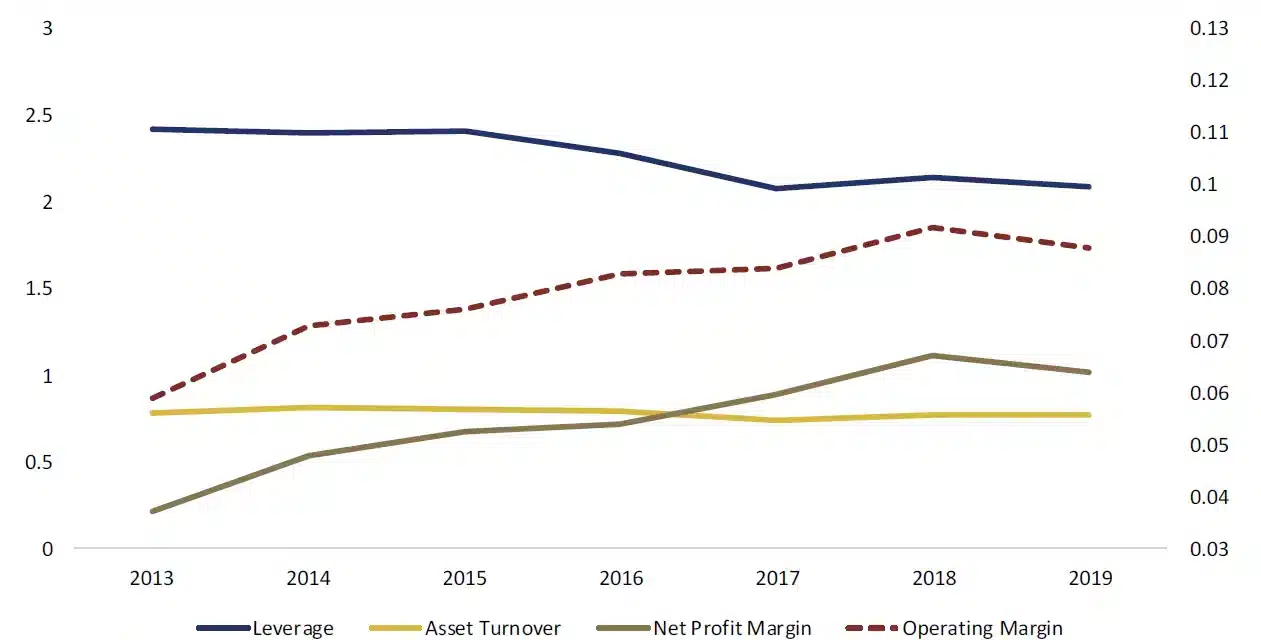
For example, increased return on equity of Japanese firms was mainly driven by higher margins, unlike in the U.S., where the improvement was primarily due to higher leverage. As shown in Fig. 9, which illustrates principal drivers behind growth in ROE, robust margin expansion is the main reason behind higher ROE numbers in Japanese market.
Figure 9: ROE drivers of companies in the MSCI Japan Index (Du Pont analysis, median method) (31.12.2013-31.12.2019)
Source: Hérens Quality Asset Management, Thomson Reuters
If this trend continues, Japanese companies might soon catch up with their international peers in terms of profitability and start to look more attractive on a global scale. One of the hypothesis, which can be put forward to explain this phenomenon, is that companies in Japan are reducing their investments in fixed assets, which are usually less productive. At the same time there is a growing share of intangible assets, which is a proxy of company’s competitiveness.
Shift of focus in corporate governance
Along with better-looking fundamentals, another point to mention is the ultimate improvement in corporate governance system, which was always very traditional in Japan and because of that had negative influence on firms’ development. However, when Shinzo Abe, Japan’s longest-serving prime minister, took office, his focus was not only on fiscal and monetary policies, but also structural reforms to improve the competitiveness of Japanese companies and attract foreign investments. For example, in 2014, the Companies Act was adopted, obliging Companies that have all Directors of the Board as insiders to “explain the reason why it is not appropriate to have an Outside Director”. Additionally, in 2015, new Japanese Corporate Governance Code was introduced, encouraging listed companies to appoint at least two independent directors on a “comply-or-explain” basis. These changes resulted into significant improvements and ‘the percentage of listed companies that appointed more than one independent director increased from 21.5% in 2014 to 93.4% in 2019’10. If this trend continues, Japanese companies might soon catch up with their international peers in terms of profitability and start to look more attractive on a global scale. One of the hypothesis, which can be put forward to explain this phenomenon, is that companies in Japan are reducing their investments in fixed assets, which are usually less productive. At the same time there is a growing share of intangible assets, which is a proxy of company’s competitiveness.
Japanese companies seem to really start prioritizing their shareholders more by not only improving efficiency of corporate governance, but also the dividend payouts. The median dividend yield of companies in the MSCI Japan index has been growing for a while, managing to catch up with the U.S in 2019 and even surpass both European and American indices this year. Dividend payout ratio also follows a similar upward trend, and has now exceeded the payouts in the U.S.
Figure 10: Median Dividend Yield (left) and median Payout Ratio (right) of MSCI Japan, MSCI US and MSCI Europe (31.12.2013-30.09.2020)

Source: Hérens Quality Asset Management, Thomson Reuters
A market full of opportunities
While the Japanese economy is tilted towards mature sectors, such as Industrials, the stock market has a fair share of innovative, rapidly growing companies, which present an enticing investment opportunity. This is supported by the fact that Japan’s R&D spending to GDP is one of the highest in the world: the ratio stood at 3.28% in 2018, which is even higher than 2.83%11 for the US. Though Japanese equity market has a more distinct value style bias as compared to US or European markets, also growth and quality investors do have a choice from the pool of innovative companies with significant economic moat, which are able to deliver sustainable high total returns. Businesses with a distinct edge are competitive on the global scale, which is why challenging domestic economic conditions are not much of an obstacle to their growth stories (see examples).
Quality company example: Keyence
Keyence, which is a global leader in factory automation equipment, was ranked as 38th most innovative company in the world by Forbes in 2018. Keyence adopts a direct selling approach and employs a wide network of individual consultants, who form the core of Company’s marketing strategy. Consultants perform on-site research at clients’ manufacturing facilities, supplying Keyence with valuable insight into clients’ operational shortcomings. This is why Keyence is able to respond to customers’ needs by developing tailor-made solutions to optimize their operations. Thanks to this approach, 70% of Company’s products are “world’s first” or “industry’s first”, leaving little room for price competition. As a result, Company’s gross profit margin exceeds 80%, and Keyence has been expanding its top line at a CAGR of 17% since 2015 until 2019. It is a true growth Company, which is also reflected in stock’s share price performance, as it has appreciated by 186% over the same period.
Quality company example: Hoya
Hoya, which was established in 1941 as a small manufacturer of optical glass, has since reshaped its product portfolio and seized opportunities in the attractive fields of Information Technology and Health Care. Hoya focuses on niche markets, such as production of lenses, endoscopes and mask blanks for semiconductors. For example, it is one of the only two companies in the world that make blanks used in next-generation EUV litography. Company’s commitment to becoming a leader in under-penetrated niche markets has borne fruit: 31% of Company’s sales are derived from products that are No. 1 on the market globally, and 44% — with products that are No. 2. Hoya’s growth story did not go unnoticed by investors, as Company’s stock price has been on a consistent upward trajectory over the last years.
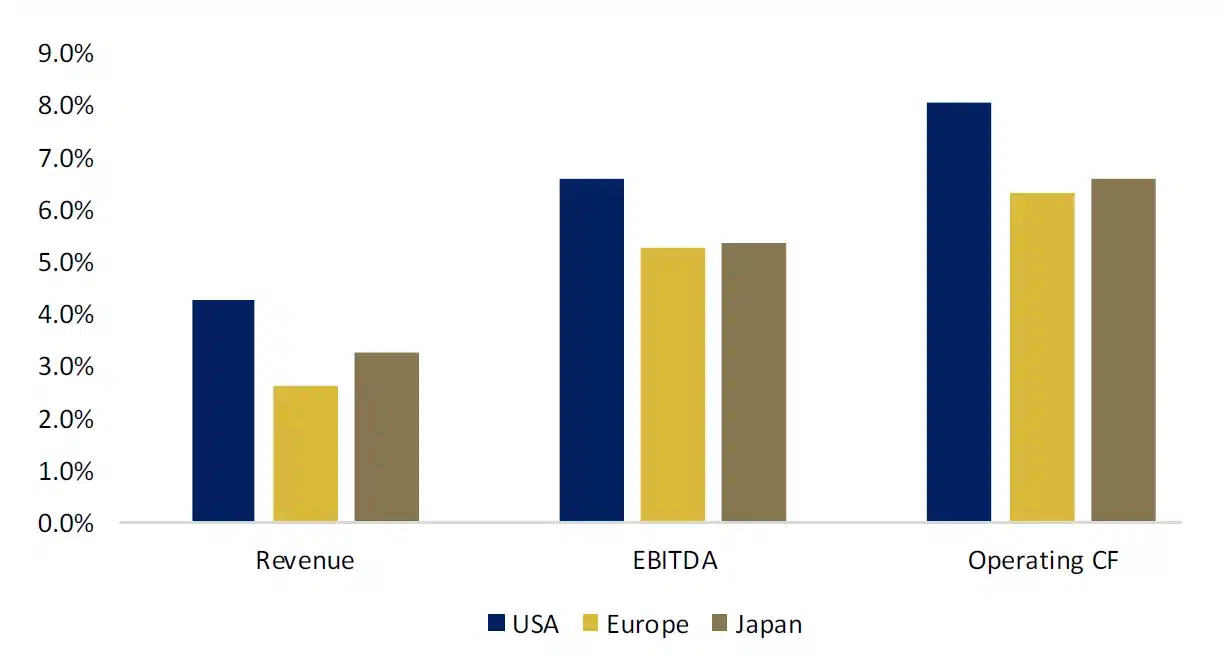
At the same time Japanese growth rates are not severely behind the ones seen among US companies, and on the comparable level with growth tempo of European ones.
Figure 11: Revenue, EBITDA and Operating Cash Flow CAGR of companies in MSCI Japan, MSCI US and MSCI Europe indices (2013-2020)
Source: Hérens Quality Asset Management, Thomson Reuters
Valuation as a bonus
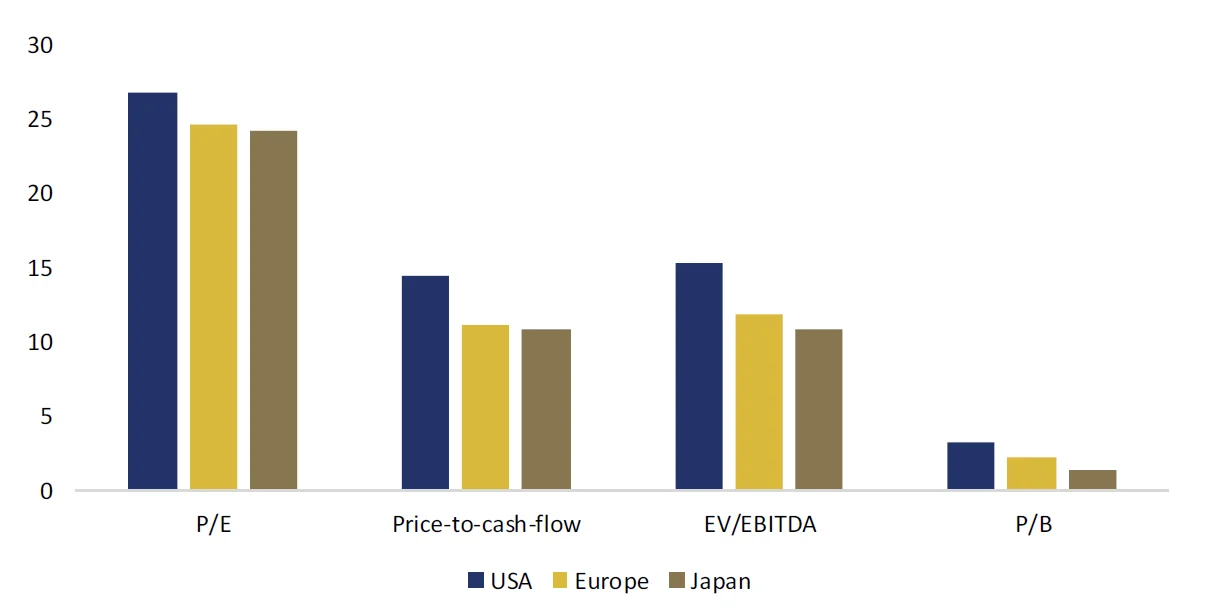
Japanese stock market offers one more advantage – valuation. Based on principal metrics, it is still on a relatively low level if compared to the USA or Europe.
Figure 12: Valuation metrics for MSCI Japan, MSCI Europe and MSCI USA as of 30.09.2020 (median method)
Source: Hérens Quality Asset Management, Thomson Reuters
Opportunity to earn even during lost decades
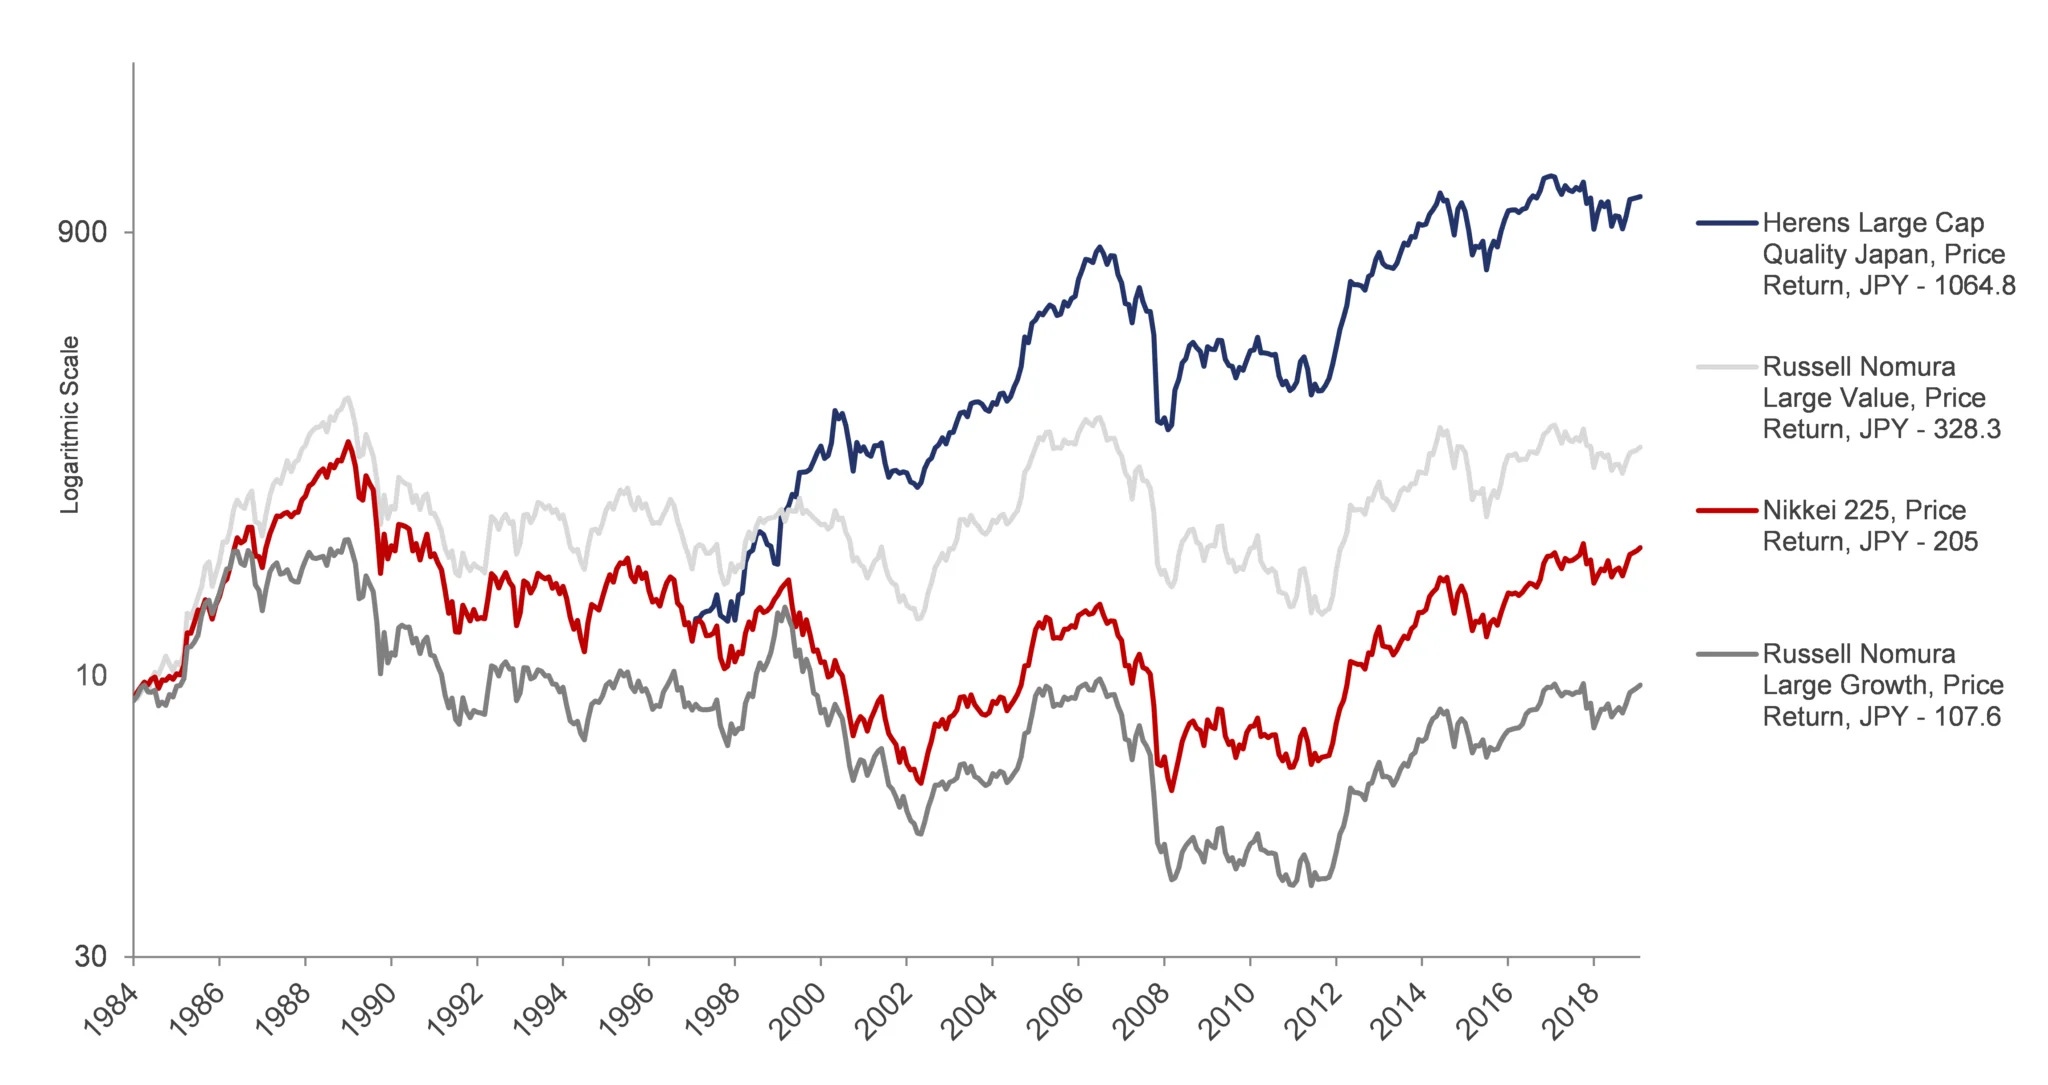
It is well-known that domestic earning potential was widely exhausted after Japanese asset price bubble burst and stock market crash, but quality companies are known for their ability to perform in any kind of environment, even if the market returns are virtually non-existent. As such, Herens Quality Japan index has been outperforming broader market since its inception, thus reinforcing validity of the above mentioned statement.
Figure 13: Herens Quality index vs. Japanese total market, value and growth indices
Source: Hérens Quality Asset Management, Thomson Reuters
HQAM Corporate Quality product: Aramus Japanese fund’s focus on Japanese hidden gems
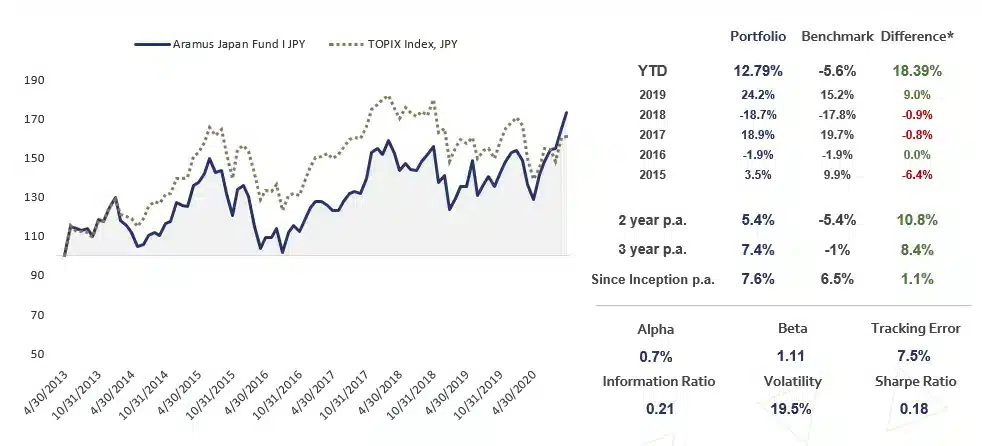
Our product, Aramus Japanese fund, which has been under management of Hérens Quality AM since 01.01.2020, is a manifestation of the attractive investment opportunities that can be found in Japanese stock market. Focus on corporate excellence, through application of strict stock selection and bottom-up analysis, can deliver outperformance, which was particularly well-demonstrated by Quality stocks in Japan that managed to stay ahead of the market during COVID-induced sell-off. Fig. 14 shows that our Japanese fund has outperformed respective benchmark by 18.39% YTD or since it came under our management. While the fund was also affected by rapidly deteriorating market sentiment, the subsequent performance clearly shows that quality companies emerge as winners once the market starts to consolidate and adjust itself.
Figure 14: Aramus Japan Fund Performance since inception in JPY (03.04.2013 – 31.08.2020; managed by Hérens Quality AM since 01.01.2020)
Source: Hérens Quality Asset Management, Thomson Reuters
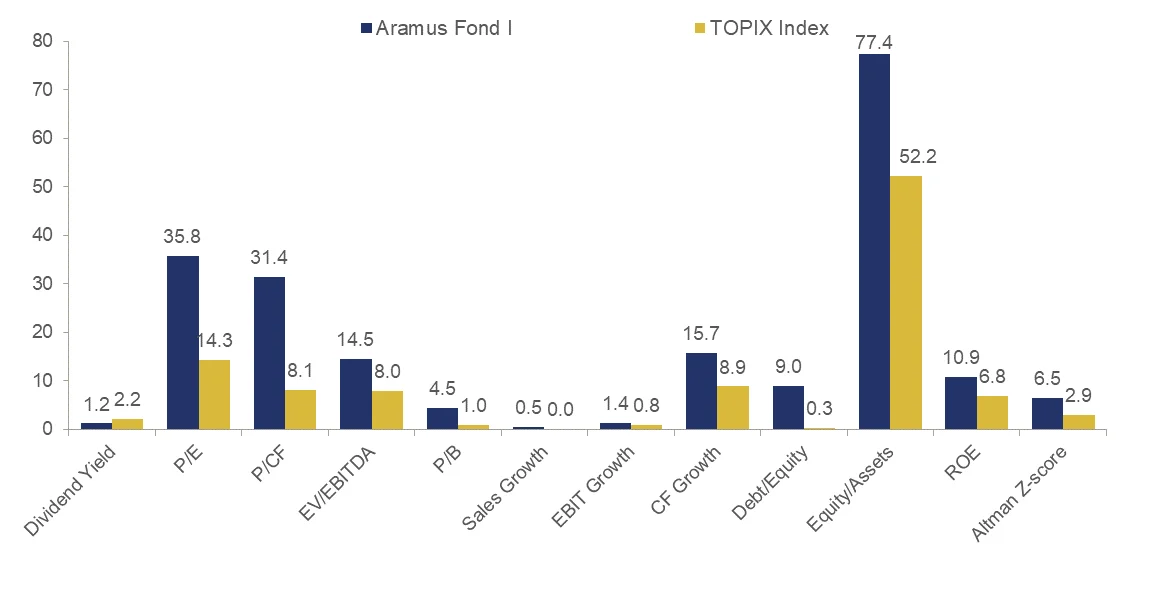
Obviously, in case of Japan, passive investing may not work as well as it does in the U.S. However, outperformance can be achieved through diligent research with the aim to identify companies that possess clear competitive advantage, are run by competent management, and have strong financials, such as sustainable debt levels, attractive returns and robust financial stability that manifests through high Altman-Z-score.
Figure 15: Aramus Japan Fundamental Characteristics vs. Topix Index as of 30.09.2020 (median method)
Source: Hérens Quality Asset Management, Thomson Reuters
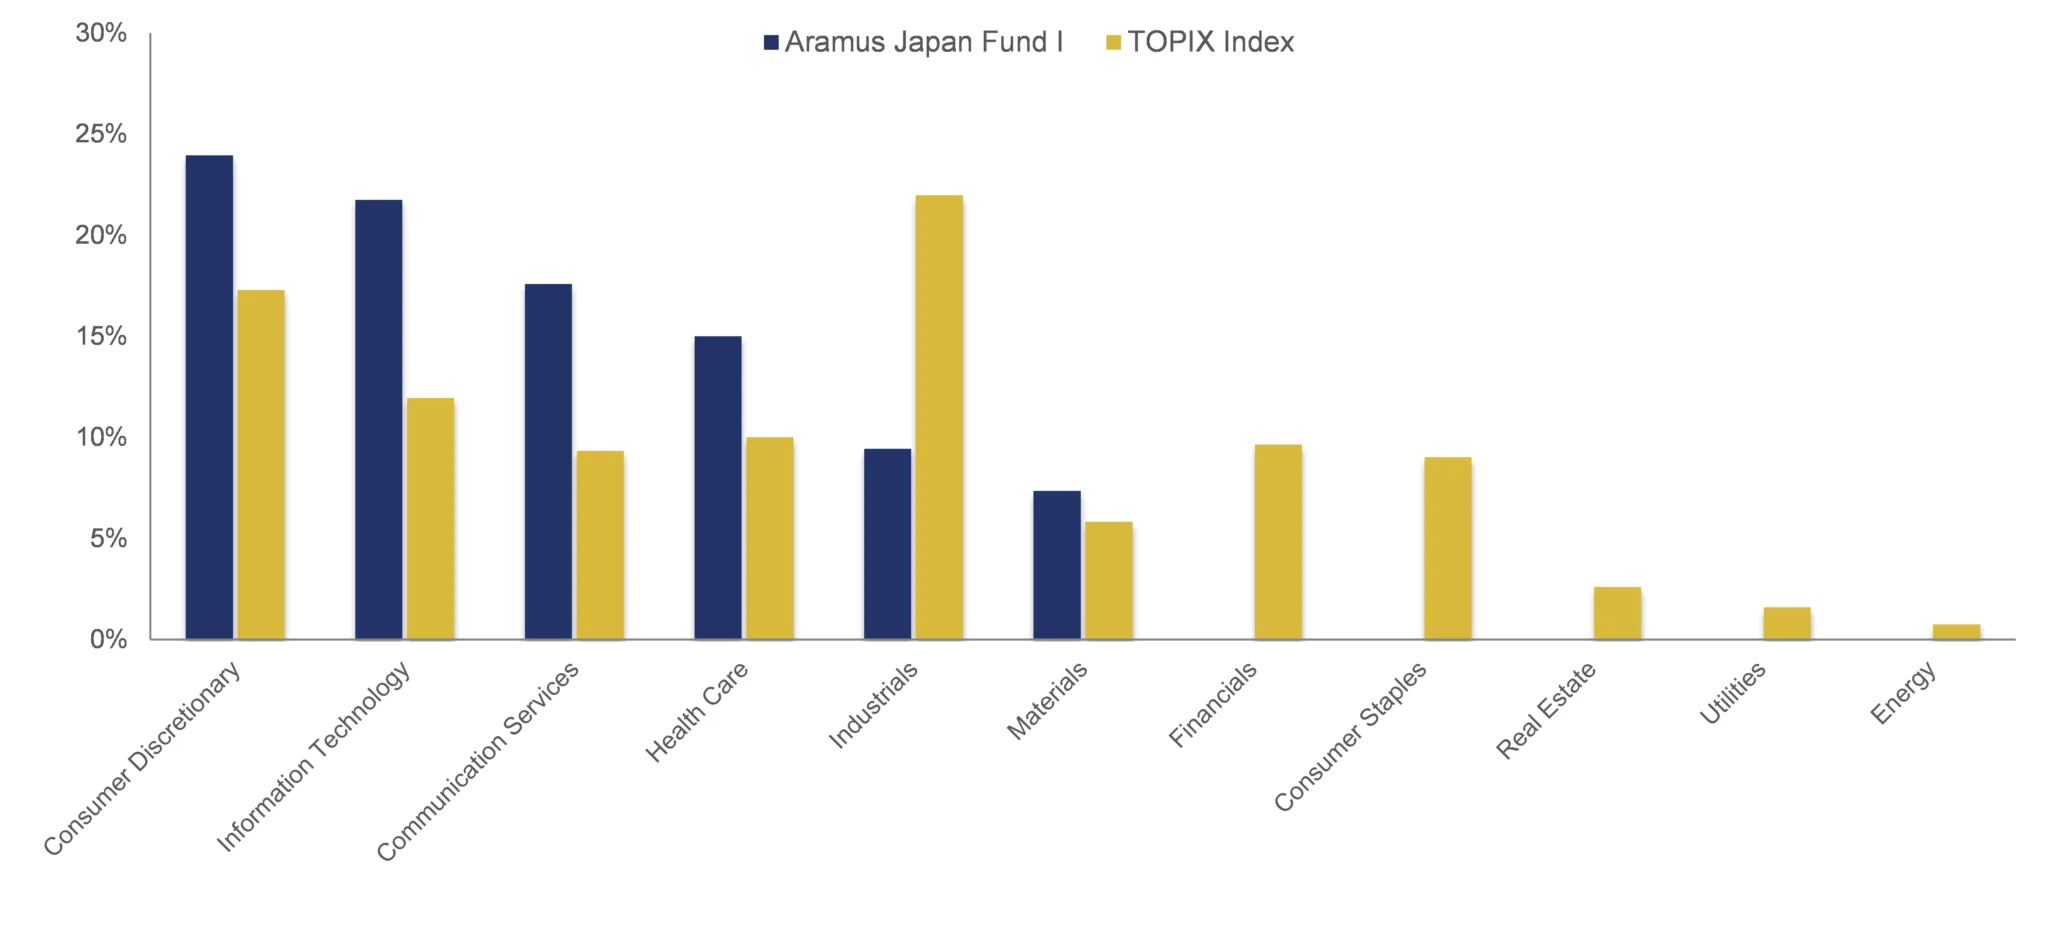
Japan’s market overweight with mature Industrials is also not an obstacle when active stock selection is applied. Careful cherry-picking allows to construct a winning portfolio with significant presence in growth sectors, such as IT, Communication Services and Health Care.
Figure 16: Sector breakdown of Aramus Fund vs. Topix Index (average 01.01.2020-30.09.2020)
Source: Hérens Quality Asset Management, Thomson Reuters
We believe that recent developments in capital allocation choices and corporate governance practices outline a secular trend, which will help Japanese companies to prosper in the long term, delivering competitive returns, which can be magnified even further, when supported by careful stock selection.
References:
- Japan Exchange Group (2020). 2019 Shareownership Survey
- Asia (2018). Four core issues Japan must address to improve corporate governance
- IMF (2012). Bank of Japan’s Quantitative and Credit Easing: Are They Now More Effective?
- Nikkei Asia Review (2019). Top ETF buyer Bank of Japan turns lender as liquidity dries up
- Yardeni Research (2020). Central Banks: Monthly Balance Sheets
- Institute of international Finance (2020). Sharp spike in global debt ratios
- BBC (2020). Why so many of the world’s oldest companies are in Japan
- Reuters (2020). Japan’s first-half bankruptcies rise for the first time in 11 years
- Global Finance Magazine (2020). COVID-19 Bankruptcies: A Global Snapshot
- Responsible investor (2020). Corporate governance reform in Japan: the second revision of the Stewardship Code.
- World Bank (2018). R&D Expense (% of GDP)
