How to increase returns on capital?
ROE of 43% in 2012, 59% in 2015, 86%- in 2017, 143% in 2019 – looks like a stellar success story until it becomes evident that for the same time frame shareholders’ capital vs total assets decreased from 55% to 20%, giving a boost to the returns. High exposure to debt to keep up high development pace and increase capital profitability is the way to go not only for MasterCard, whom figures above belong to. There are many companies, which finance their balance sheets primarily with debt, and investors tend to fall in love with them as long as they disclose promising development or improvement in the cash flows. Just look at the recent performance of Tesla or Netflix, whose risky balance sheets with equity ratio of 18% and 21% respectively did not restrain investors from buying their shares after one has reported improvement in cash flows and increased vehicle production, while another surprised with strong growth in international streaming.
Moreover, investors would be ready to provide them with additional capital to finance spending needs given their lower than average debt to market cap ratio. There is a significant amount of cheap money on the market, which companies readily use to own advantage by increasing the amount of operated assets. The detailed analysis of total shareholder’s return of US companies, which is produced according to BCG methodology 1, shows that historically there have been cycles of external financing extension and shortening. From a fundamental point of view, it seems that we are on the edge of new leveraging cycle, which would support further corporate growth and, obviously, increase in capital returns.
Growing debt does not always lead to SELL decision
Already now corporate debt in US reaches a historical high of 10 trillion USD, which is 47% of the overall economy2. It means worsening quality of balance sheets and leads to higher bankruptcy risks. Just in our February insight (link), focusing on Altman Z-score’s analytical value added, we pointed out that for 62% of US companies bankruptcy probability has increased in the last 5 years.
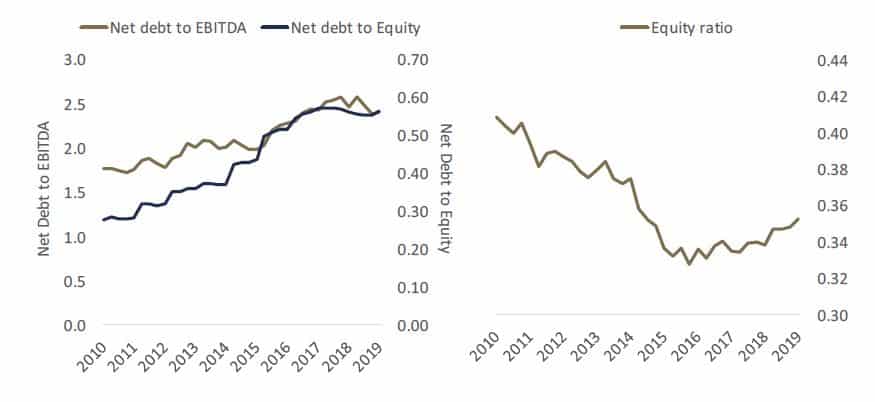
The charts below illustrate balance sheets’ situation very well: 1) equity ratio has been in a long-term declining trend; 2) net debt is increasing vs EBITDA and equity. Noteworthy, spike in net debt has been sharper if compared to equity rather than to the profit figures, hinting about companies’ ability to employ debt in efficient manner to generate higher earnings.
Fig. 1: Debt ratios , MSCI USA

Source: Hérens Quality Asset Management, Reuters
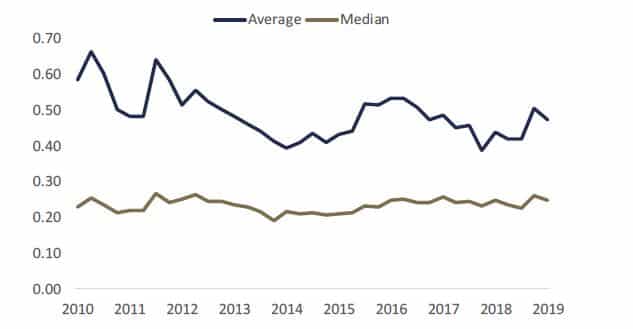
We have also examined relationship between debt and the market capitalization, and there was no surprise for us to see that over time this ratio stayed virtually unchanged. This is an interesting trend, which indicates that investors don’t mind that companies are becoming risky on the balance sheet side. However, debt loading should be done in a wise way – like investing cash in R&D, marketing and other related expenses to generate further growth.

Source: Hérens Quality Asset Management, Reuters
Ironically, these investments often do not become part of the total assets in any form of intangibles (brand values, R&D in process, etc.), but rather are expenses. It leaves the company with lower retained earnings and, therefore, with lower equity capital and higher leverage.
Are quality companies in the trend?
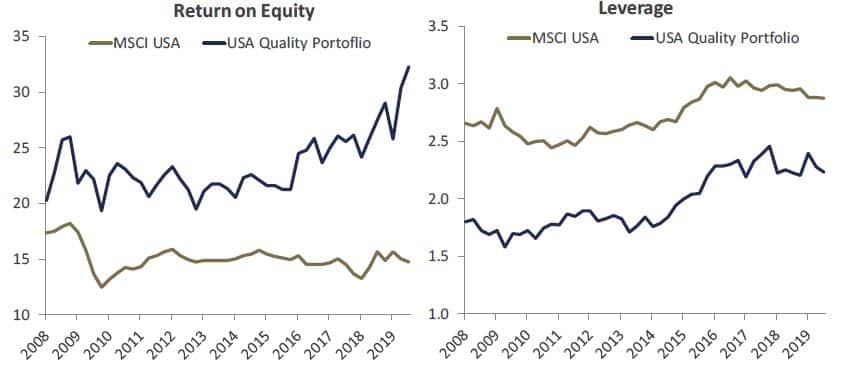
Obviously, yes. Quality companies are also among the ones who exploit the leveraging trend to use cheap money in order to expand operations, innovate, enlarge addressable markets, make share buybacks etc. Amount of leverage for quality companies has been growing even faster than for the general market, and sooner or later these investments translate into higher capital returns – returns on equity capital have been increasing substantially, too (fig.3).
Fig. 3: ROE and Leverage, USA Quality vs. MSCI USA

Source: Hérens Quality Asset Management, Reuters
Mind the cash flows and KPIs
How not to burn the fingers when being invested in highly leveraged company? The temptation to invest in such type of company is high, as at high stakes you usually get high return. However, this mantra only applies to cases when the company is well-managed, has clear strategic and plausible investment focuses. These aspects require certain subjectivity in judgement, but the assessment can also be nicely done with the quantitative measures, such as key performance indicators and the measures provided by the big data. Latter could provide a good insight about company’s development pace well before the corporation itself publishes next quarterly results. Additionally, one should mind cash flow development of the company. Naturally, if a business is just burning the cash of bond- or stock-holders, reporting negative operating cash flows, it should be clearly a warning sign and a call to reconsider investment.
References
- Altman, Edward I. (September 1968). “Financial Ratios, Discriminant Analysis and the Prediction of Corporate Bankruptcy”. Journal of Finance: 189–209
- Strauss, D. (2019). “Corporate America’s debt load is nearing $10 trillion, a record 47% of the overall economy — and experts around the world are sounding the alarm” (link)
